Generalized Observation and Reflection Platform (GORP)
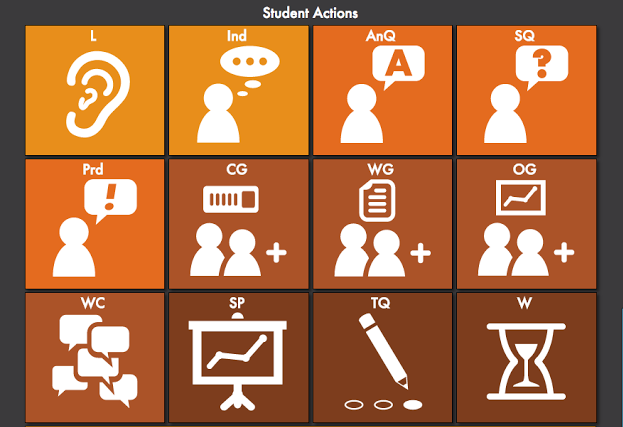 The GORP tool offers a solution to the challenge of measuring the extent to which faculty members are engaging in active learning techniques, which a growing body of evidence indicates benefit student learning. Building on the COPUS (Classroom Observation Protocol for Undergraduate STEM) instrument developed the Carl Wieman Science Education Initiative at the University of British Columbia to characterize university STEM classroom practices, GORP is a web-based system for carrying out classroom observations using user-defined protocols and analyzing the data collected during observations. The tool allows observers to record data using a simple, mobile-friendly fully customizable interface.
- Learn More
-
TGORP is a web-based system for carrying out classroom observations using customizable, user-defined protocols and analyzing the data collected during observations.
GORP 2GORP allows observers to
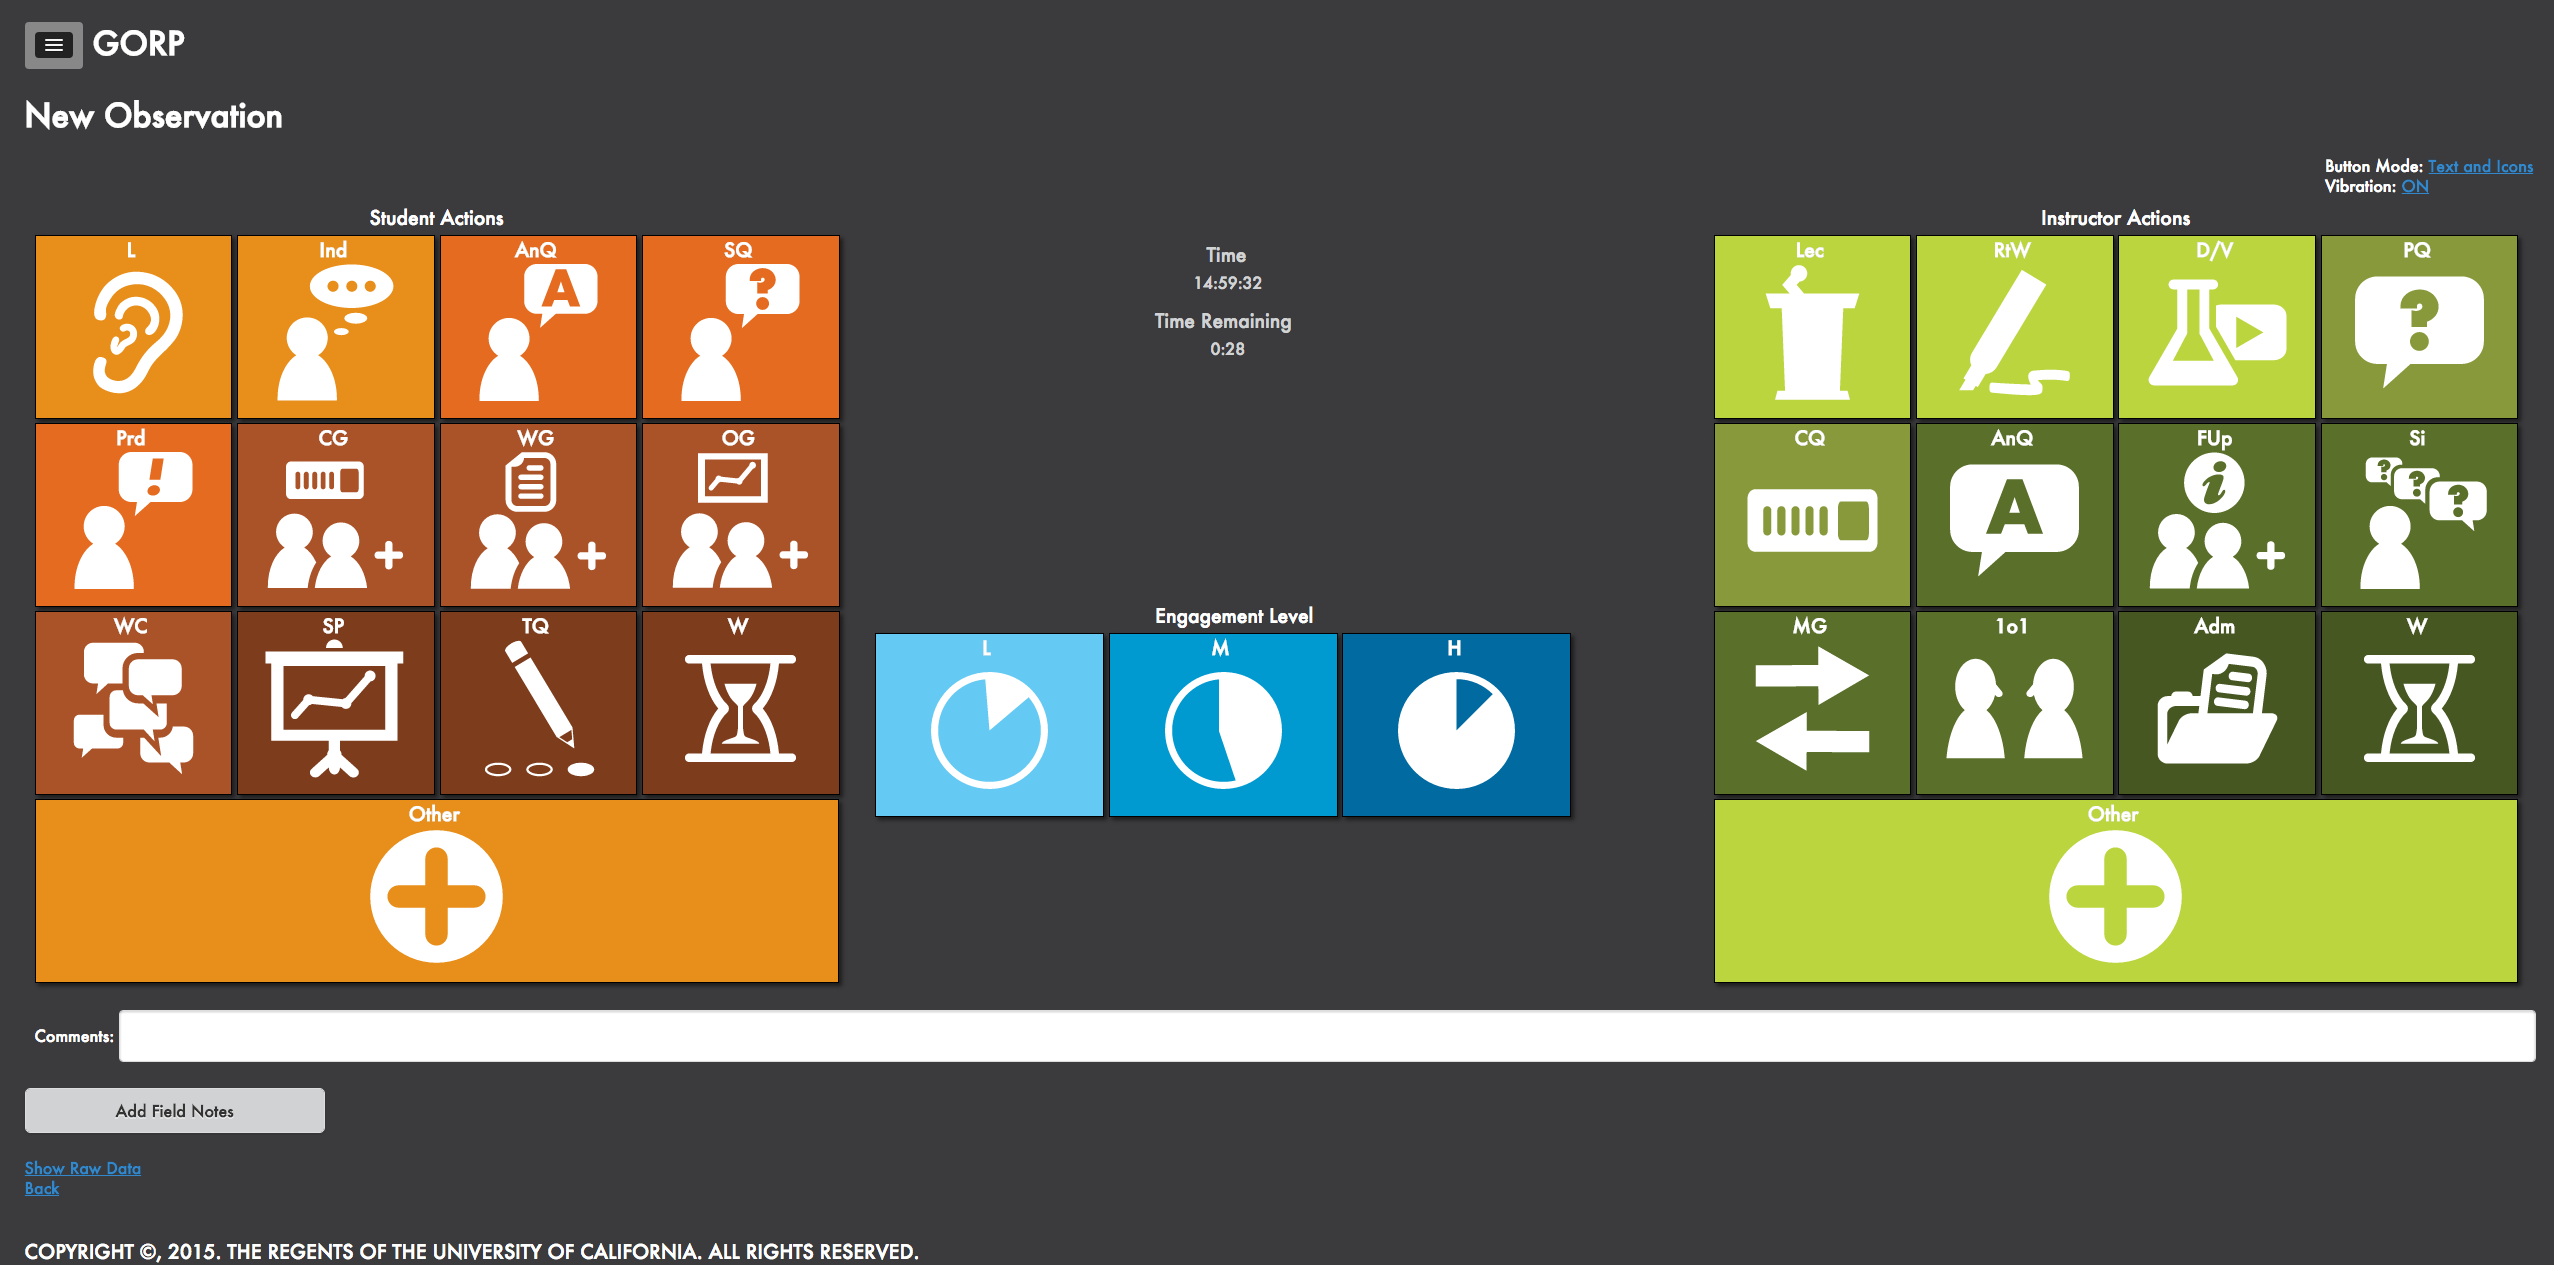 record data using a simple, mobile-friendly, interface. GORP's interface is fully customizable in appearance.
GORP's interface is fully customizable and designed to work on mobile and desktop devices.
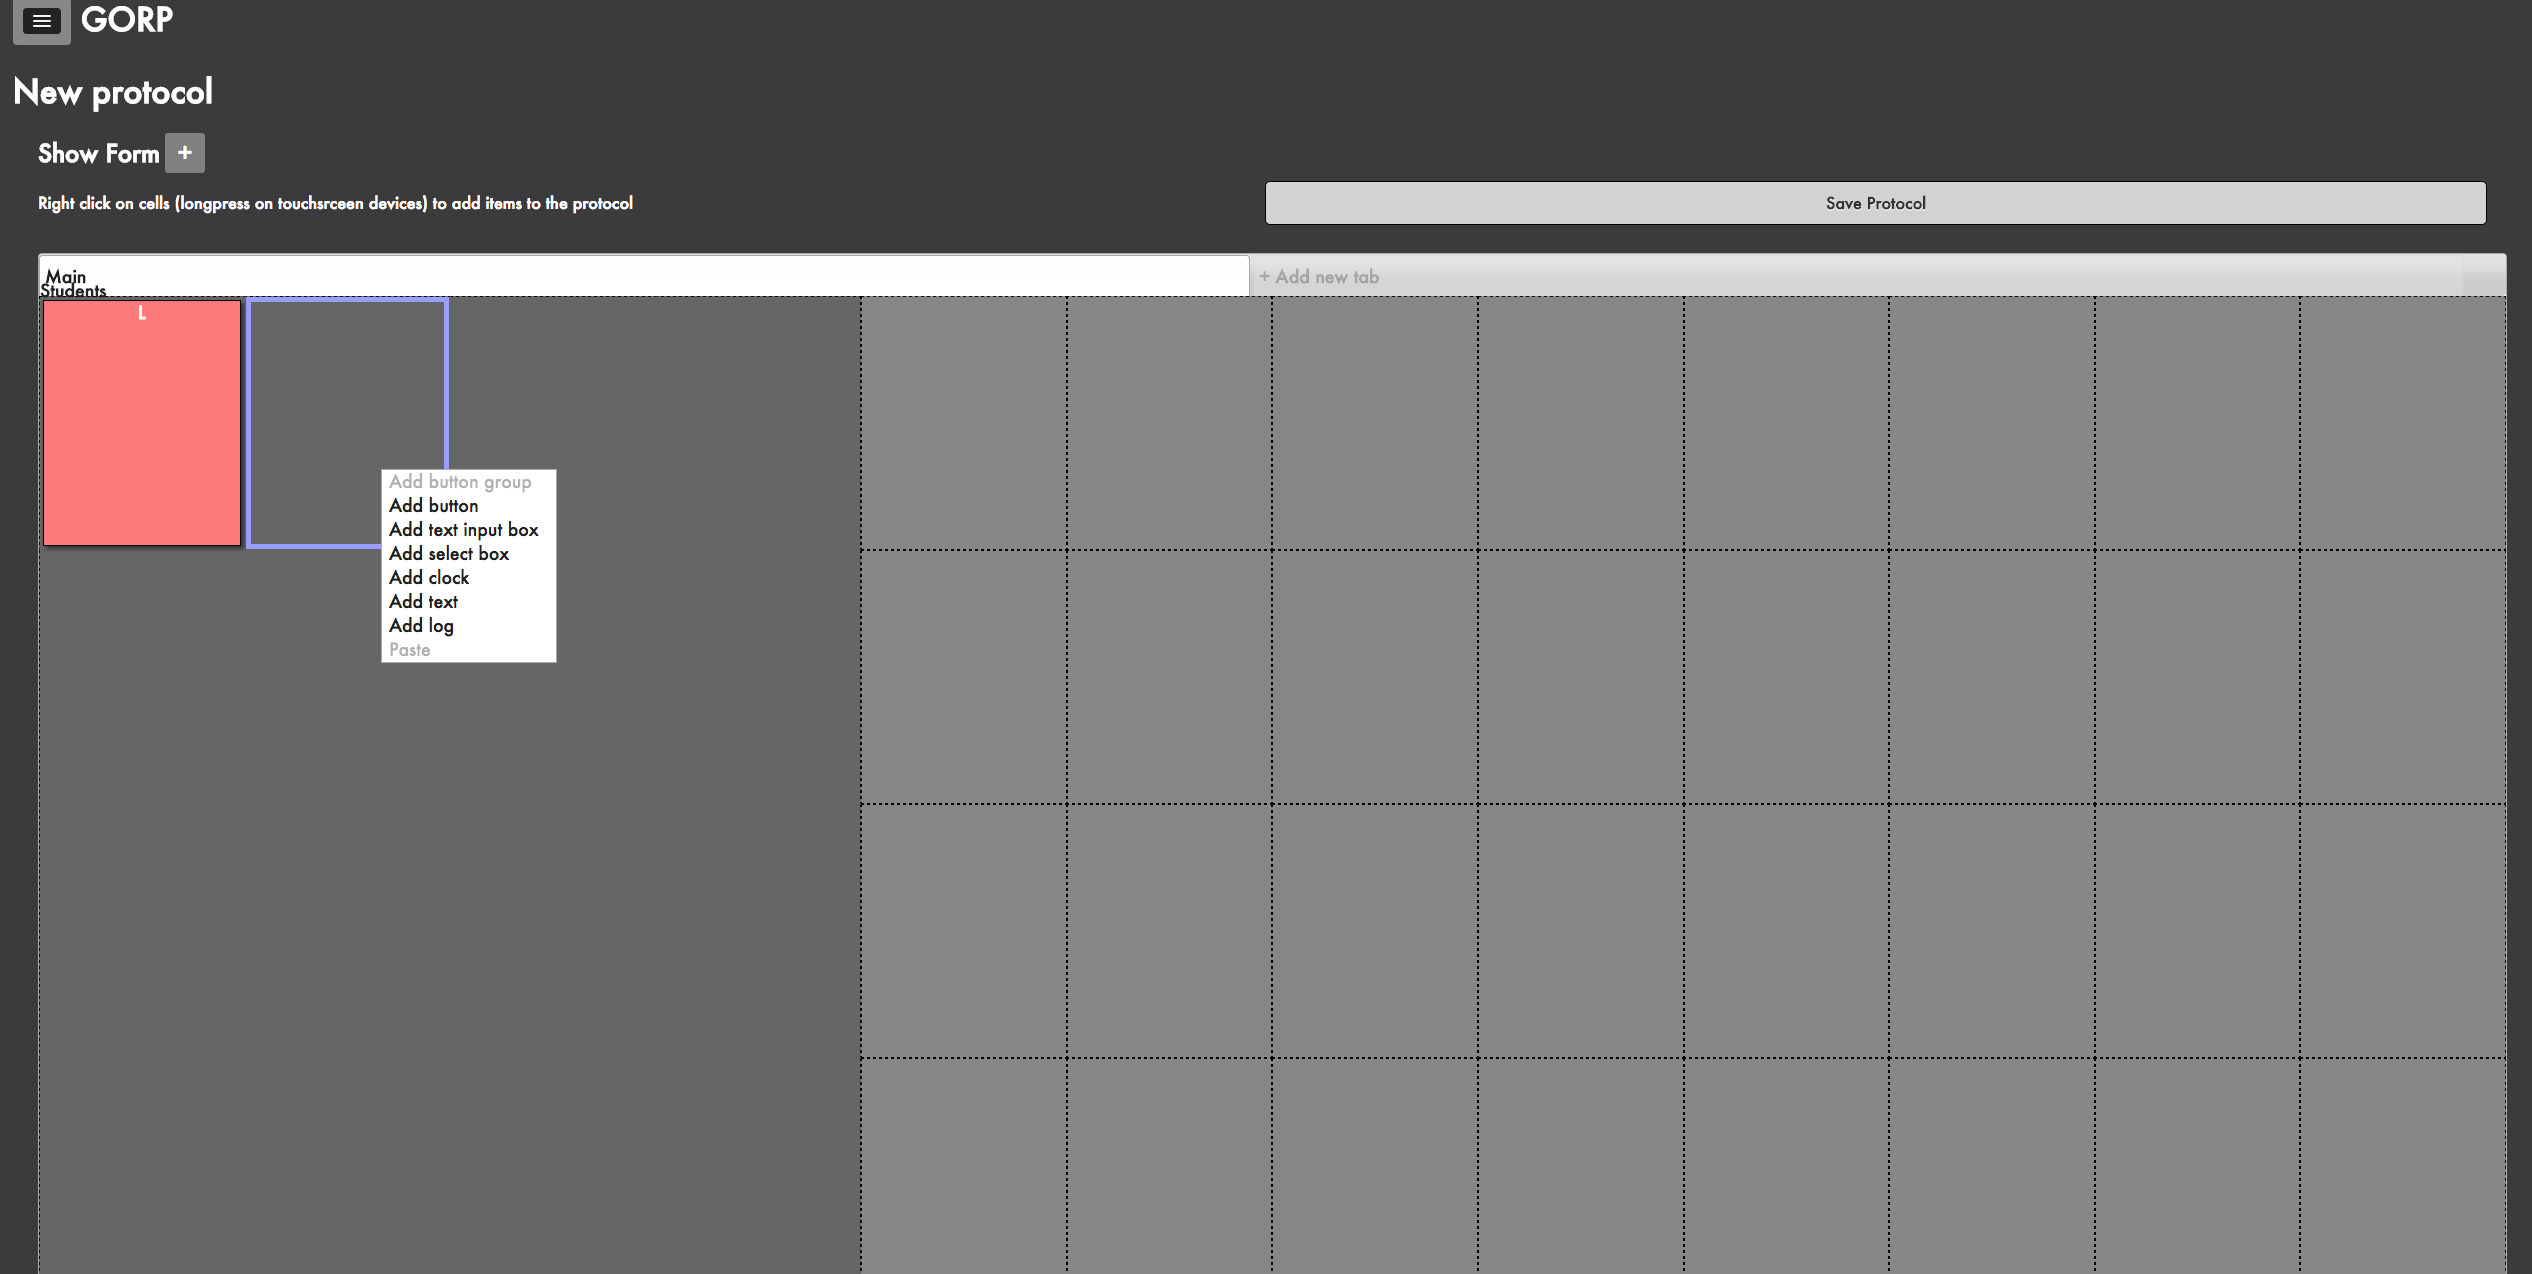
In addition to a collection of community created observation protocols, GORP allows you to create your own protocol from scratch or by modifying an existing protocol.
When you sign-up, search for your university or institution in the list or a create a new one. Each university has their own private environment within the tool. GORP is hosted by Amazon Web Services and any data you enter is kept encrypted and private. Information you create is only accessible to users within your institution and then only if they have been given the appropriate permissions by an admin user at your institution.
GORP is still under development and feedback is always appreciated. We would be excited to here suggestions for new features.GORP was developed as part of a Helmsley Trust grant in collaboration with the TEA community.
Measuring the amount and type of active learning in classrooms requires the use of an observational protocol. This short video introduces the use of the Generalized Observation and Reflection Protocol (GORP) to assess active learning in the classroom. The video shows how GORP is applied using the COPUS protocol and explores the differences in types of classroom instruction and the link between active learning in the classroom and student learning outcomes.
Contact: Matt Steinwachs
Ribbon Tool
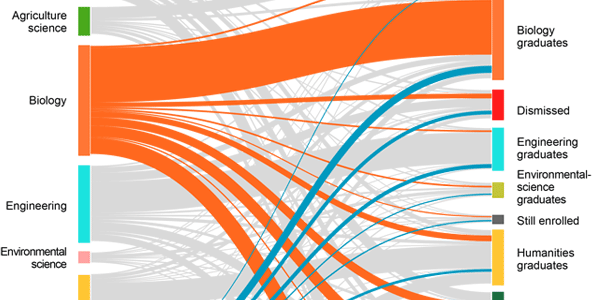 The Ribbon tool is a visualization system used to understand the pathways that students take between majors or disciplinary clusters. It aggregates student data based on user-defined categories and shows the population flows between these categories over user-defined spans of time. Understanding the factors that cause major migration can inform research into universities’ retention practices.
- Learn More
-
The Ribbon tool’s visualizations help to identify patterns and reveal data points that help shape questions, whether from an overall view or focused more granularly on particular points in curricula or other factors that appear to impact success within a major or group of majors. Why do students in a particular major leave at a certain point in the 4-year pathway? Are there things that could be done to mitigate migration? The tool was recently highlighted in the international science journal Nature’s article, “University learning: Improve undergraduate science education,” as a way to use longitudinal student data to inform retention and recruitment efforts.
Using the Tool
Categories can be subdivided one or more times. Example: Students at a university could be categorized by enrollment status, college, or general academic discipline, and then major. This allows you to see flows between majors and colleges over time.

The ribbon tool can show student population flows within a university over time You can isolate categories to track a certain group over time. Example: Starting from the entire student population, isolate students enrolled as chemistry majors at a certain time and then follow them over time to see how many graduate.
You can filter population based on user provided demographics. Example: You want to see the attrition rates of first generation college students as opposed to non-first generation students.
These categories and demographic filters are completely flexible which means this tool can be used to understand any sort of population movements that may interest an institution.
Try it with your own data by preparing CSV or JSON data in this format.
When you sign up, search for your university or institution in the list or create a new one. Each university has its own private environment within the tool. The Ribbon Tool is hosted by Amazon Web Services and any data you upload is kept encrypted and private. Diagrams and data you create are only accessible by you until you explicitly share them with other users in your university.
The Ribbon Tool is still under development and feedback is always appreciated. We would be excited to hear suggestions for new features - please send your feedback to Matt Steinwachs.
The Ribbon Tool was developed as part of a Helmsley Trust grant in collaboration with the TEA community.
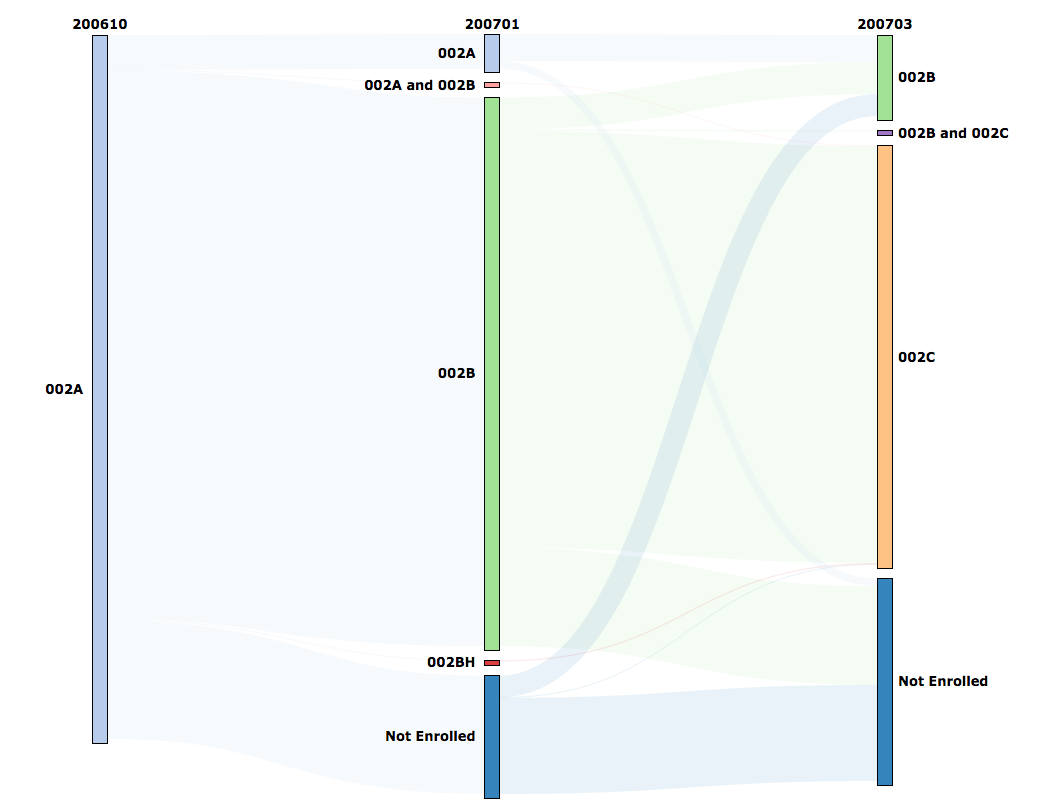
Here, we only wanted to examine students who were enrolled in a certain chemistry course at a certain time and then see their course taking behavior in subsequent courses in a series.
